- GOOGLE GOODIES
- >
- YL-GFSD3 - Data Analysis (Year Long)
YL-GFSD3 - Data Analysis (Year Long)
SKU:
gfs-ylda-2018
$1,000,000.00
$0.00
Unavailable
per item
Description
By using the YL-GFSD3 | Data Analysis Program in conjunction with GFSD3, teachers can now track each students assessments throughout the entire year. With just a few simple tricks, and a few simple clicks, student data for the year is within your grasp. Oh, and it also can project each of your students success in EOY Assessments with great accuracy.
NOTE: This program only works in conjunction with GFSD3.
YL-GFSD 3.0 - Data Analysis Program (Year Long)
|
Use GFSD3 and "Link" specific data from each assessment to this program to have a running record of the student data.
'MASTER TEST ROSTER' SETUP
A Google Form will need to be completed by all students that will take the GFSD3 assessments. This form will just consist of the following information:
SUBGROUP SETUP
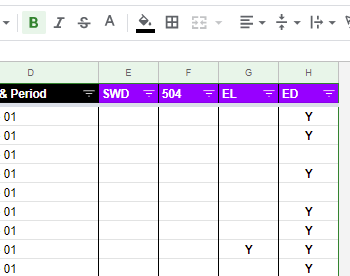
After the 'Student Test Rosters' Google Form has been completed by your students, send all information to a NEW Google Spreadsheet. The Following columns will be used:
IMPORTANT AND MUST OCCUR:
START SHEET of YL-GFSD3
The purpose of this program is to pull multiple assessments from GFSD3 into one place to analyze data over time. With that, we can also categorize our assessments and place weights for each category. For example 8th grade GA Studies has four categories: Geography, History, Gov/Civics, and Economics. By using your EOY weights, this program can make projections for each student on how they will perform on the EOY assessment. Simply complete the purple cells in Columns G-I, and the data will then be calculated throughout the program.
NOTE: If you give multiple benchmarks, this could also be one category name. To just calculate the benchmark data, mark the weight for the benchmarks at 100%. THE GFSD3 SPREADSHEET KEYS
The first step is to link the 'MASTER Test Roster' spreadsheet to this YL-GFSD3 program spreadsheet. You will need the GFSD3 spreadsheet key for all of your other assessments so just so you know what it is, check out this picture below:
Once you copied the 'Master Test Roster' spreadsheet key, paste it in the yellow cell (D11) to link the Master Test Roster spreadsheet to this YL-GFSD3 spreadsheet.
NOTE: On ALL spreadsheet keys, you will also need to include quotation marks at the beginning and ending of the spreadsheet key. It will look something like this: "0Ap-gnKfDH3FMdExBSjh4NXVIUmh1SkxSajlTTGJ0RWc"
This process will continue for EACH GFSD3 assessment that will be linked into this program. Start with your first GFSD3 assessment in Cell C12 and give it a very short test identifier (H1). Then complete the spreadsheet key requirement. Finally, choose The Category Number for the assessment. There is one more thing to do, which is completed on the "ALLOW ACCESS" sheet.
ALLOW ACCESS SHEET of YL-GFSD3
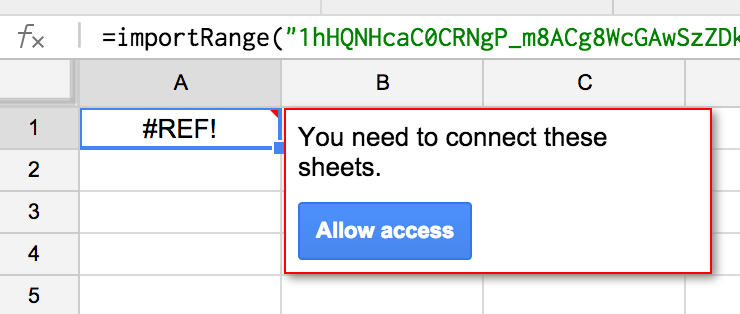
For all of the data to be transferred over from each GFSD3 assessment, and after the spreadsheet key is entered into the START sheet, you will need to finalize this process on the ALLOW ACCESS sheet. Simply find the PINK cells (C6, L6, T6, AB6, and so on...) and select the cell. When you do, you will see the image below, and all you have to do next is to just click the blue button with the words "Allow access." This will complete the process of takign the student data from the GFSD3 assessments and bring them over to the YL-GFSD3 program.
Note: Every time the original GFSD3 assessment is updated (another test submission occurs), the new data from that file will automatically be send here. ONCE ALLOW ACCESS HAS OCCURRED
AT A GLANCE - Sheet (No Clicks Needed)
Way too much to list here, but nothing for you to do. Go to this sheet for a whole ton of data broken down by teacher, all the way down to student subgroups. GRAPHS - Sheet (No Clicks Needed)
Three graphs are here:
SUBGROUPS - Sheet
IF IF IF you completed on the "Master Test Roster" the subgroup section, this sheet is for you! Identify how many subgroup students you have and what their overall Z-Score average is AND the Overall Rank. This can be complete on other sheets, but on this sheet you have complete filter-ability. TEST SCORES - Sheet
This sheet has test scores from all linked GFSD3 assessments. You are able to filter to find exactly what you are looking for. Also, please take note of Column B, where you will be able to filter and identify the number of subgroups each student belongs to. You will also be able to filter by each specific subgroup. SECTIONS - Sheet
This sheet has all of the "sections" from the test scores of all linked GFSD3 assessments. You are able to filter to find exactly what you are looking for. Also, please take note of Column B, where you will be able to filter and identify the number of subgroups each student belongs to. You will also be able to filter by each specific subgroup. Z-SCORES - Sheet
This sheet has Z-Scores from all linked GFSD3 assessments. Since the scores are color-coded, you will be able to easily identify which students regularly score above the median of all test scores, or not! You can also identify the average z-score for each subgroup. LEVELS - Sheet
This sheet is where the EOY projections are! You can learn the number of each student and percentage for each Level for the EOY assessment. Not only that, you can break it down by subgroup, and a few more goodies:
CLASS SECTIONS - Sheet (No Clicks Needed)
Each Teacher & Class Period's averages on each section are identified here - along with the averages per section for all teachers. The color coding is based on each teacher - so you will be able to easily identify a teacher's weakest section for all linked GFSD3 assessments. CLASS RANKS - Sheet (No Clicks Needed)
Based on the scores of all sections of all linked GFSD3 assessments, each Teacher is assigned an overall score and is ranked. You can easily identify a class period who may need more assistance. "Green Yellow or Orange" colors means that class period is in the top 3 of that section and the more of the colors, the better performing the class is. CLASS AVERAGES - Sheet (No Clicks Needed)
Simply put, you can easily identify based on color coding and data the overall average of each assessment per class. The color coding is based on each class period. STUDENT NAMES - Sheet
All you have to do is select a Teacher & Class Period. Once that happens, student names will appear in the following ways:
END OF YEAR - TO DO
EOY RESULTS - Sheet
Again, all is filterable. This is the same sheet as the LEVELS sheet, except for a few things that you have the option of completing. When you receive the results of your state given EOY assessment, and you want to know if this whole YL-GFSD3 process was worth it (IT IS), complete Column Q "ACTUAL EOY LEVELS." You will need to select the correct level for each student. Once that is completed, the last column to complete is Column CG "REASON FOR NO." If the "ACCURATE EOY PROJECTION was "NO", this is where you identify why. It was either "Higher" or "Lower" - just select the correct reason. EOY FINAL - Sheet (No Clicks Needed)
Since all data has been entered, and collected, this sheet has it all broken down for you when it comes to overall numbers. Nothing to do, everything to see. AUTOCRAT - Sheet
It is NOT ready yet. But... Wouldn't it be nice to be able to send a student a detailed report of all the assessments for the year, including EOY data, all in one Google Doc? Yeah, I think so too. Sadly, it is not completed yet, but it will be. There is nothing I can do about it now, but know this is what I am working on now. |
SETUP: Master Test RosterYL-GFSD3 Complete Tutorial |


